
Pokémon Market Analysis
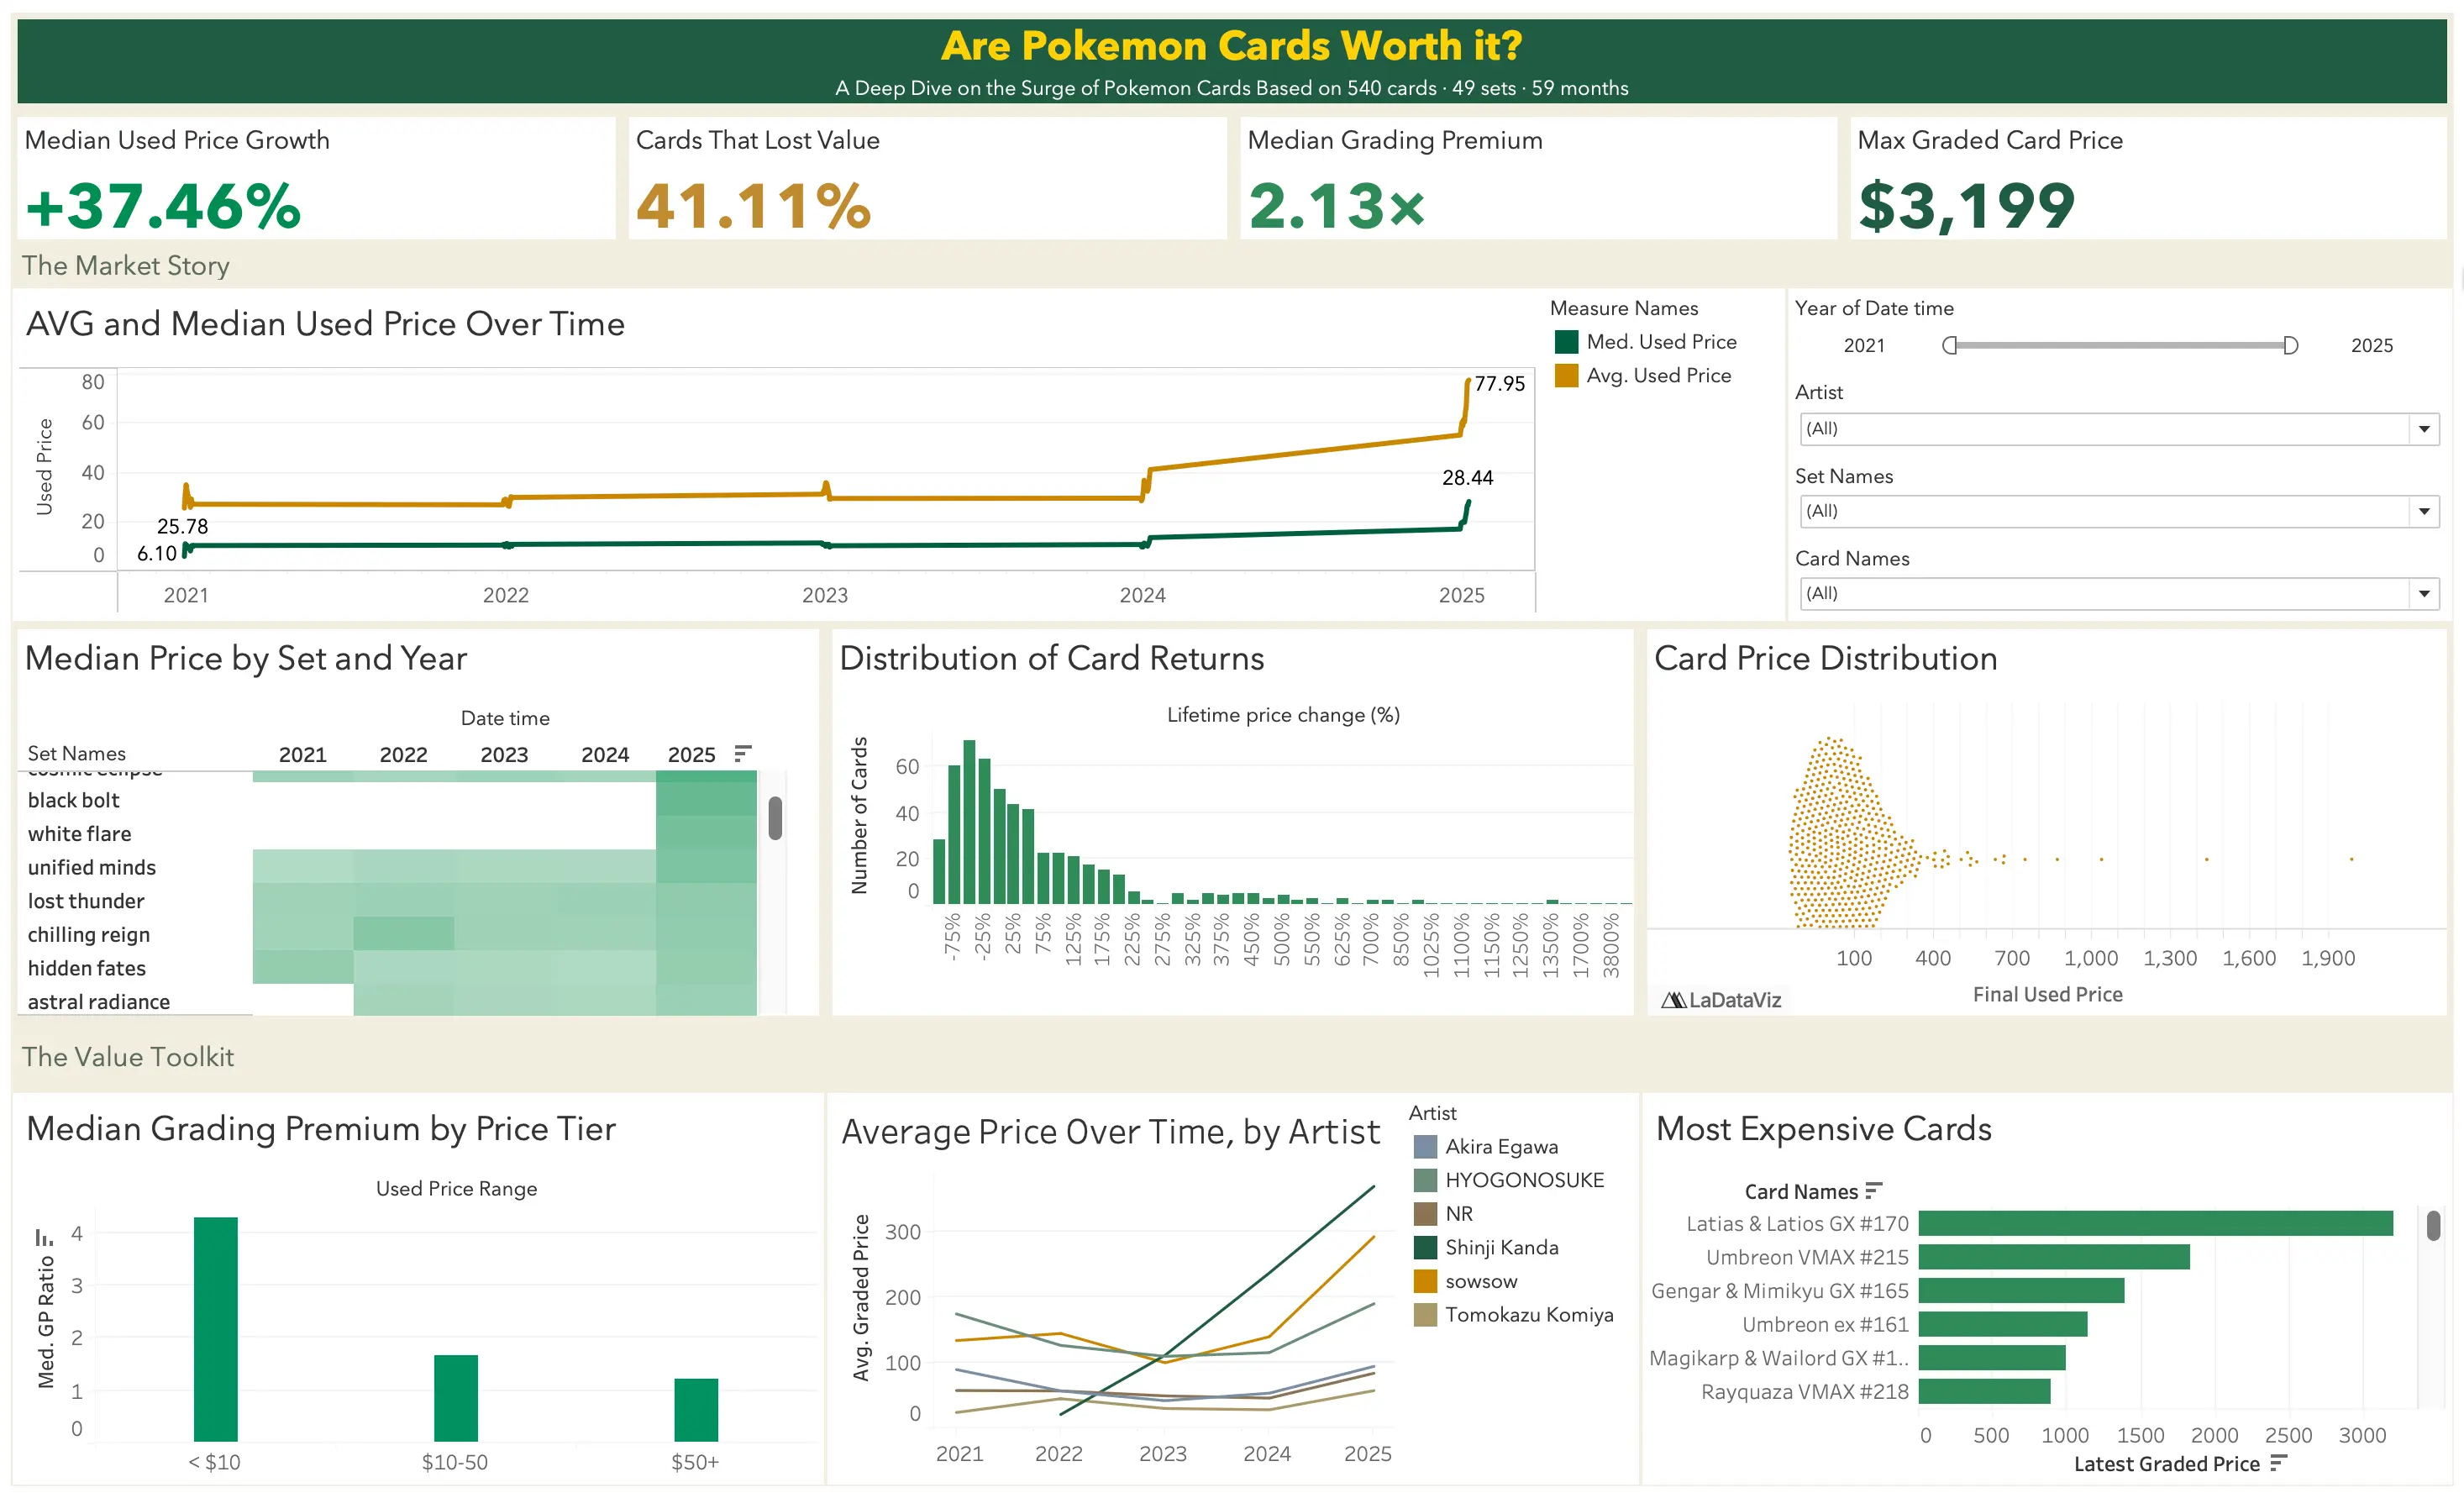
Did buying or grading Pokémon cards pay off? 540 cards, five years, one composition effect.
- Role
- Data analyst
- Timeline
- Two days, Jul 12 to 13, 2026
- Team
- Two of usWith Nathaniel Josh B. Quinto
- Stack
- Tableau
- Python
- pandas
- Statistics
- Result
- A perfect 100/100
A Miraidon from McDonald's
It started with a Miraidon card I got from McDonald's. Shiny, fancy-looking, and I had no idea if it was worth anything. So I asked the obvious question: what actually makes a card valuable?

Talking it over with Nat, we remembered the cards that do skyrocket (hello, Logan Paul's Charizard). Then our data viz class handed us a project: find data, analyze it, and visualize it. Perfect timing. Is there a real Pokémon card boom like the one on TikTok, or is something else going on?
We took 540 chase cards (the V, VMAX, GX, and ex cards people actually hunt) across 49 sets, priced every month from January 2021 to November 2025.
The boom is real. Sort of.
The dashboard is fully interactive. Click a metric, a set, or a card, and everything else re-filters to match. That's exactly how we caught it.
Across the full window, the median price rose 37.46%. Looks like a boom. Then we moved one filter, ending the window at 2024 instead, and the number flipped: down 22.84%, with 60% of cards underwater instead of 41%.
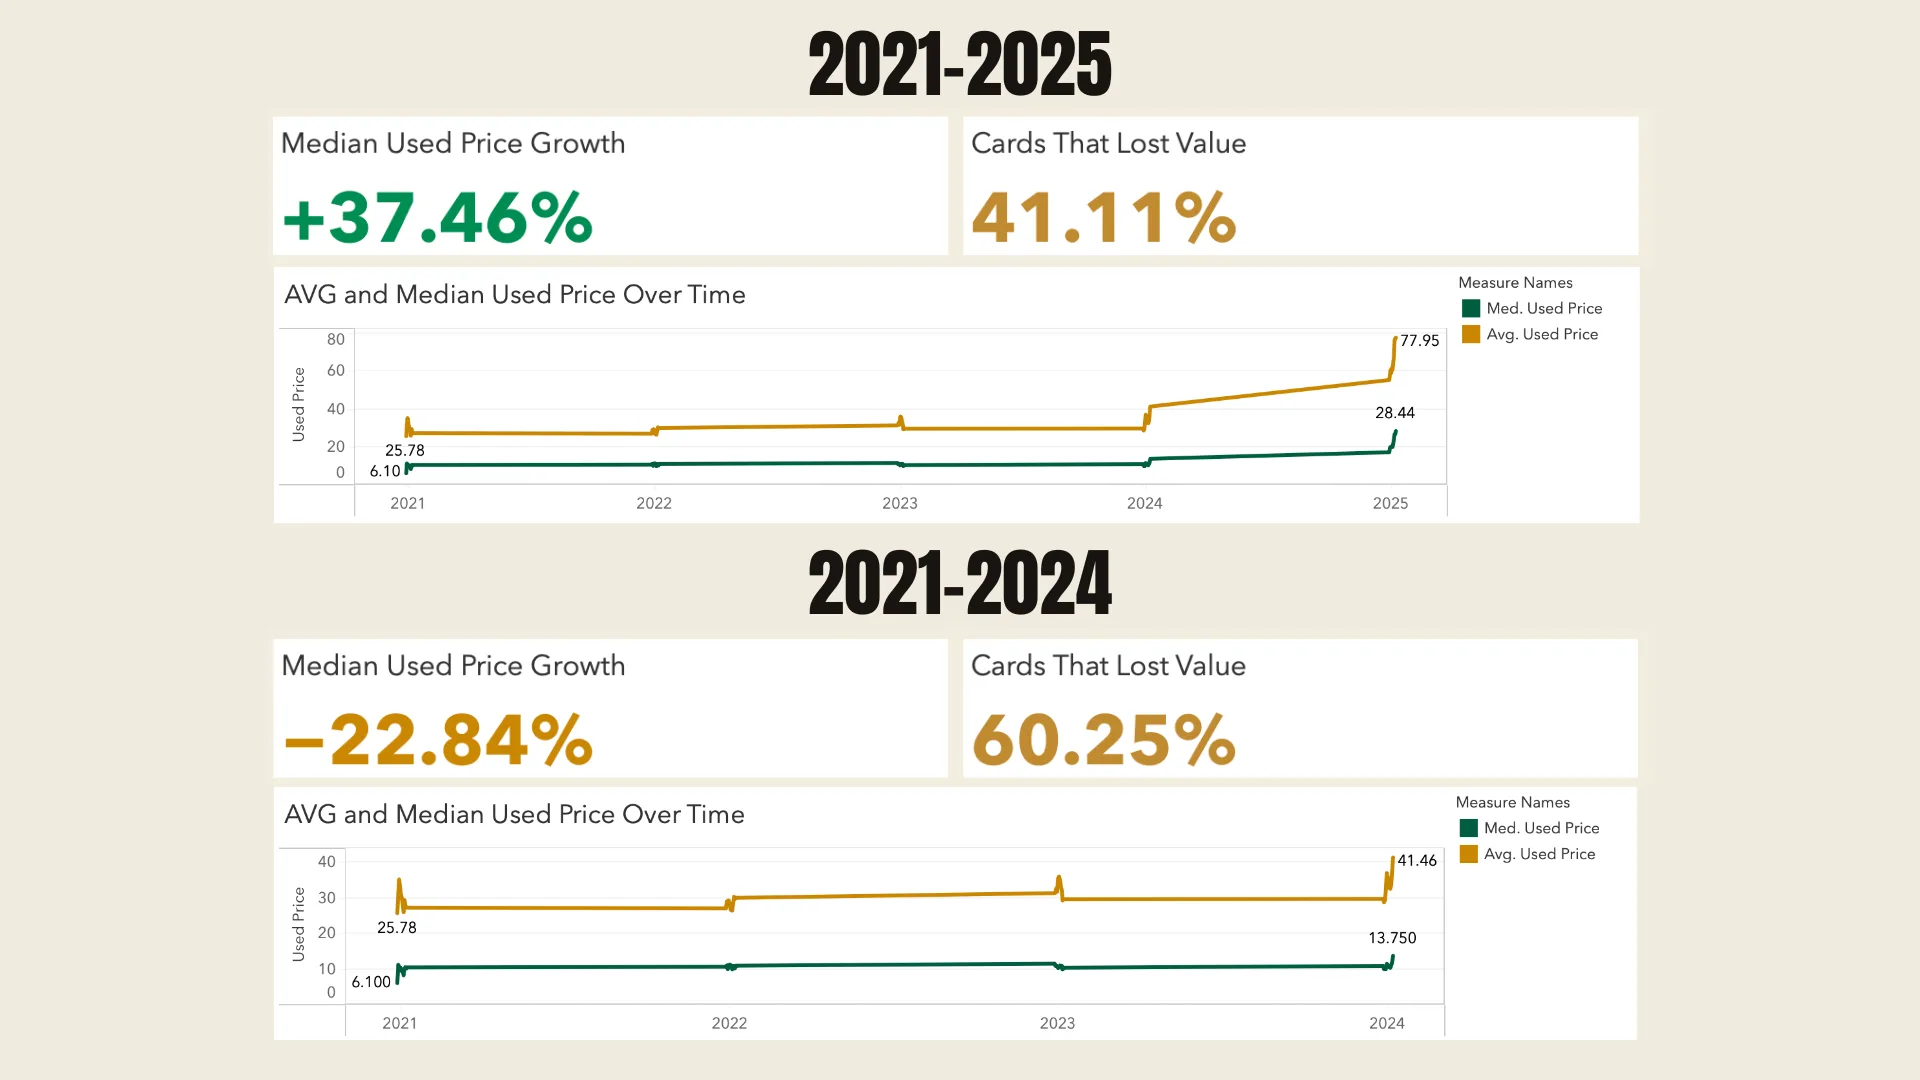
Nothing about the cards changed. The window did.
The headline gain was a composition effect. Cards join the dataset when they're released, so the sample keeps filling up with newer, pricier cards. The median climbs because the mix changes, not because anyone's collection gained value. Think of a class average going up after a few top scorers transfer in. From afar, it looks like the whole class is doing better. Look closer, and everyone else's grades are right where they were. The average moved because of who joined, not because anyone's grades changed.
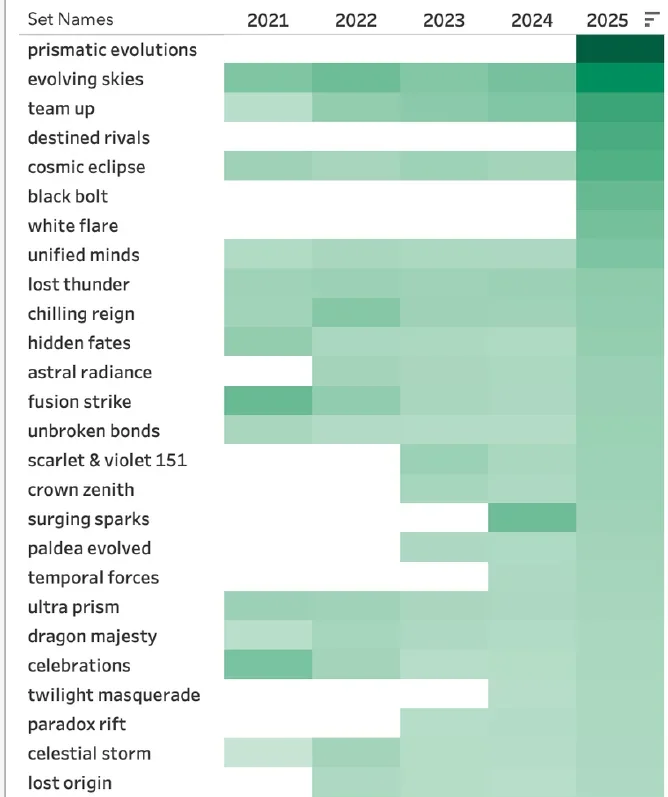
Only 2025 brought a real, broad rise, and mostly in sets released that year. Even then, 41% of cards sat below their first tracked price. Over the whole stretch, the median card returned about 4% a year. Philippine land does 8 to 12.
Starting from a blank canvas
The hardest part was getting started. A blank Tableau canvas, and no idea which graphs to use. Where do I even start? How am I going to get through this?
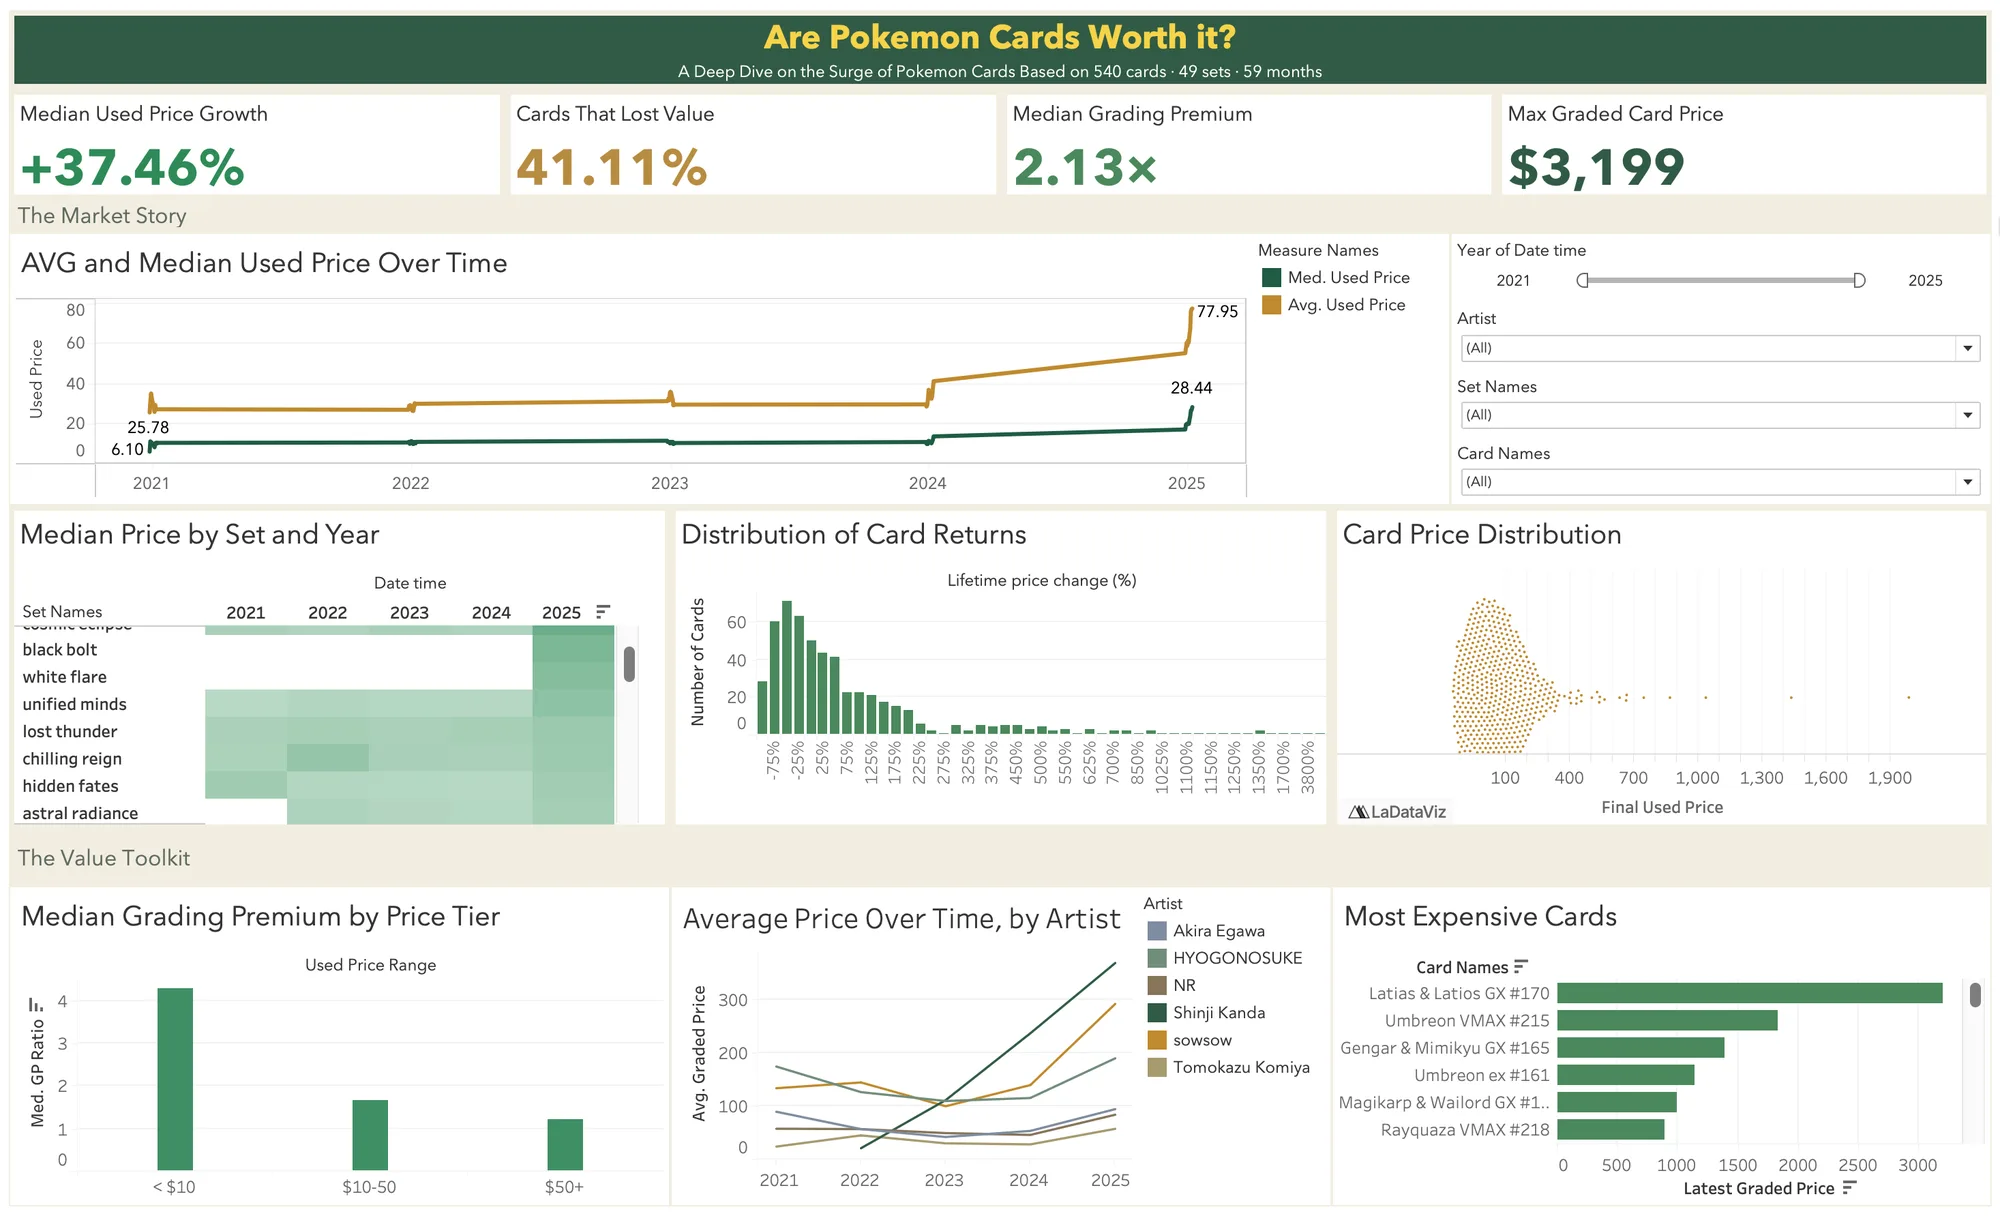
But everything starts steamrolling once the first graph is down. Big Angry Numbers on top, the important graphs next, and filters on the side. Before I knew it, I was already there. Nat turned it into the deck, and we presented on July 13, two days after we started.
So, should you grade that card?
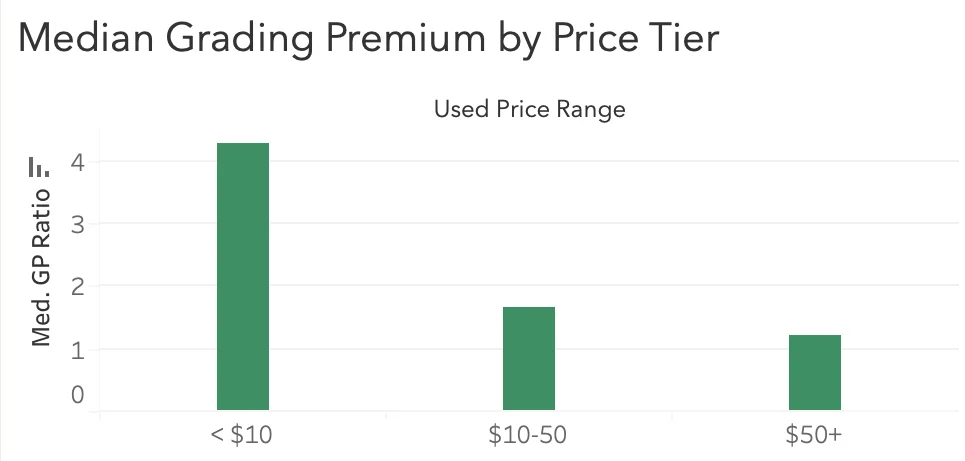
If you're about to grade a $20 card: do it in bulk. Grading roughly doubles a card's value (a 2.13× median premium), but that premium collapses as the price climbs, from about 4.3× under $10 to about 1.2× above $50. Grading also costs around $25 to $80 a card, so 4.3× on a $5 card is only about $20. For a single card to clear even a $25 fee, it needs to be worth about $125 raw. Below that, bulk deals are the way.
One more thing: every card in this data was already a chase card. The ones nobody hunts are out there too, which makes it even scarier. If you're going to buy, go for chase cards.
What I'd do next
This one's done. What's next is getting it in front of more people who'd appreciate it.
Why it made the four
It's my first zero-to-hero data science project, and it found something that goes against what the graph says. That's when it clicked for me: a graph can mislead even when every number on it is right. The composition effect doesn't show up from one look. It's only there once you get your hands on the data.
It also got a perfect 100/100.

The lesson, in four words: most cards don't moon.